

States with the most progressive tax codes are ranked significantly better places to live, work, and raise a family
A broad comparison of popular national rankings reveals that states with the most progressive tax codes outperform those favored by anti-tax organizations, the Tax Foundation, the American Legislative Exchange Council and Art Laffer (ALEC-Laffer) on quality-of-life and other measures.
As states begin their 2026 legislative sessions, legislators are grappling with massive federal budget cuts to fund tax cuts in the ironically named One Big Beautiful Bill (H.R. 1). These cuts, in addition to potential revenue shortfalls, could trigger major healthcare, hunger, and education crises in states.
States often serve as laboratories for national policies–especially tax policy. While there are still states that are replicating a failed experiment that cut income tax rates and increased general sales taxes (see: Kansas in the mid-2010s), there is a growing list of states turning the tide to produce better and more equitable tax codes. States have collectively raised top personal and corporate tax rates 65 times since 2000. In 2026, many states are debating legislation to raise revenue by taxing wealth and high incomes, raising corporate profit taxes, and other progressive tax policies.
A new study from the State Revenue Alliance finds that states with more progressive tax systems often rank higher on economic and quality-of-life measures. This novel approach to assessing the qualitative aspects of tax policy compares states using popular annual rankings, such as U.S. News' Economic Opportunity, CNBC’s Quality of Life, and the Annie E. Casey Foundation’s KIDS COUNT.

Amber Wallin, Executive Director of the State Revenue Alliance
“While individual rankings and indices cannot give the full picture of life in a state, SRA’s findings reveal a too-common trend about taxes in America: state policy has disproportionately benefited the wealthy and well-connected, said Amber Wallin, Executive Director of the State Revenue Alliance. “The information also points to how everyone benefits when schools are well-funded, and when economic security and health are top priorities – even if that means raising revenue through taxes on the richest residents and most profitable corporations. It’s established that people don’t move based on state tax rates, and many of these business lobby listicles promoting the idea are also suspect. Our study simply points out that the proof is in the pudding – states that invest in their future are putting their residents' well-being at the top of many lists.”
The examination finds that states ranked favorably by anti-tax activists do much worse, more often, on quality of life rankings, and barely do better on business-friendly rankings than the 10 states with the most progressive state tax systems.
The chart below compares states that lead the nation on three widely cited state tax rankings: the 2026 Tax Foundation’s State Tax Competitiveness Index, the 2025 ALEC-Laffer State Economic Competitiveness Index, and the Institute on Taxation and Economic Policy’s Tax Inequality Index (“Who Pays, 7th Edition, 2024).
To compare states with the most progressive income taxes, we have also included states with no income tax and the five states that have cut taxes the most for millionaires.
Combined, these rankings represent a massive amount of data and prominent analysis. SRA’s analysis of these disparate rankings creates a clear picture of states that rank highly on ITEP’s Inequality Index, as well as the top-ranked states on the Tax Foundation and ALEC tax competitiveness indexes.
Individually, these rankings can all be argued to be inadequate or hold various methodological assumptions that reflect a policy point of view. Our analysis cannot and does not prove correlation, causation, or come to a scientific conclusion about how much tax increases lead to better schools, higher GDP, or why people move. It’s meant to show that the proof is in the pudding – that states are better off when the rich pay what they owe in taxes, allowing investment in all kids’ education, basic infrastructure, health, and public services.
Eleven national rankings are listed across the table. They are nationally recognized aggregators of census and other public information that compare the 50 states. The numbers are the average score for that grouping, defined below, on a 1-50 state ranking. These rankings do not include the District of Columbia or any other U.S. territory.
The lower the number for the grouping, the better that cohort of states ranks in each of the outlet’s rankings, EXCEPT for Wallethub’s “Financial Distress” where the lower number represents more financial distress. A score over 25 indicates that the average of the state cohort is in the bottom half of the rankings, conversely, a score below 25 would be considered to be in the top half of all states.
State Index and Cohort Definitions
States with the highest Personal Income Tax (PIT) rates: All states that have a top personal income tax rate higher than 9.25%. This includes California, Hawaii, Minnesota, New Jersey, New York, and Oregon.
2026 Tax Foundation’s State Tax Competitiveness Index: Ten states at the top of the Tax Foundation’s latest ranking of states. This ranking is largely considered to be a reflection of states with low taxes and a regulatory environment. These states are Alaska, Florida, Idaho, Indiana, Montana, New Hampshire, South Dakota, Tennessee, Texas, and Wyoming.
2025 ALEC-Laffer State Economic Competitiveness Index: Together, ALEC and Laffer Associates author Rich States: Poor States, which includes an index that, “forecast[s] based on a state’s current standing in 15 state policy variables,” that favor states that cut spending and lower taxes. ALEC-Laffer’s forecast includes: Arizona, Arkansas, Idaho, Indiana, North Carolina, North Dakota, South Dakota, Tennessee, Texas, and Utah.
Institute on Taxation and Economic Policy’s Tax Inequality Index: This index “measures the effects of each state’s tax system on income inequality by assessing the impact state tax policy has on the post-tax incomes of taxpayers at different income levels.” It is often used to compare states’ tax codes based on progressive/regressive features. The most progressive states, according to the index are: California, Maine, Maryland, Massachusetts, Minnesota, New Jersey, New Mexico, New York, Oregon, and Vermont.
States with no income tax: Alaska, Florida, New Hampshire, Nevada, South Dakota, Tennessee, Texas, Washington, and Wyoming.
Millionaire tax cuts: This cohort of states is distinguished by enacting “the most significant income tax cuts for millionaires in 2025”. They are Kansas, Mississippi, Missouri, Ohio, and Oklahoma.
Data Findings:
Top states on the Tax Foundation and ALEC-Laffer rankings score more poorly, more often, and barely do better on business-friendly rankings than ITEP’s Inequality Index on 11 national rankings.
The findings indicate that states with the most progressive tax codes are ranked significantly better places to live, work, and raise a family.
ITEP’s most progressive states or states with the highest Personal Income Tax rates ranked better than the Tax Foundation, ALEC-Laffer or states with no income tax in 9 of the 11 different categories.
Overall, the most progressive tax codes, ranked in ITEP’s Inequality Index, rank in the top half of all states on 10 of 11 ranking scales.
The Tax Foundation’s top 10 in the bottom half in 6 rankings, the ALEC-Laffer index averages appear in the bottom half of states in 8 of the 11 rankings.
States that are highlighted as ITEP’s top ten progressive list appeared collectively in the top 10 of the nation 41 times across all 11 rankings, compared to 20 times among the Tax Foundation’s top-ranked, and 17 times for the highest-ranked on the ALEC/Laffer index.
States that are at the top of the ALEC-Laffer rating appear 23 times among the 10 worst across the 11 rankings. The best tax codes according to the ITEP rankings appear 10 times in the bottom of the collective rankings. Those that score highest on the Tax Foundation’s ranking are rated among the worst 10 a total of 17 times.
Massachusetts was ranked #1 on Overall Economy, Best State to Live In, and Wallethub’s Best State to Raise a Family, the Commonwealth Fund’s Health Systems and in the top ten on an additional 5 lists.
New Hampshire is ranked #1 for Economic Opportunity, Consumer Affairs Best State to Raise a Family and the Kids Count ranking, and in the top ten in 4 additional lists.
New Mexico is a state on the ITEP most progressive tax list that appears in the bottom 10 the most often, 6 times.
A NOTE ON NEW MEXICO: New Mexico has, until recently, underinvested in health and childcare and heavily relied on a regressive tax code and volatile oil and gas severance taxes for public revenue. A series of recent tax improvements has helped the state move from 27th to 9th in tax code progressivity (ITEP Inequality index). We expect that as New Mexico continues to make its tax code more progressive and invest in programs that help raise the quality of life, the state will improve on all measures in this study.
No other state in the top 10 of the ITEP progressive tax index appears in the bottom 10 the rankings more than once.
Multiple states on the Tax Foundation and ALEC-Laffer indexes appear at the bottom 10 of the rankings. Alaska appears 5 times, Texas appears 6 times, and Arkansas appears the most of any state, 8 times out of the 11 different rankings.
In the two categories that the Tax Foundation and ALEC’s top states rated better, CNBC’s top-rated for business and SimplifyLLC’s best states for entrepreneurs, the states with the most progressive tax systems scored well, too. Minnesota was ranked 10th in CNBC’s business ranking, and three states (Maine, Oregon, and Vermont) were in the top 10 on SimplifyLLC's ranking of the best places for entrepreneurs, more than either of the business-oriented indexes.
States with the top income rates lead states with no income taxes in 9 of the 11 measures, including the overall economy.
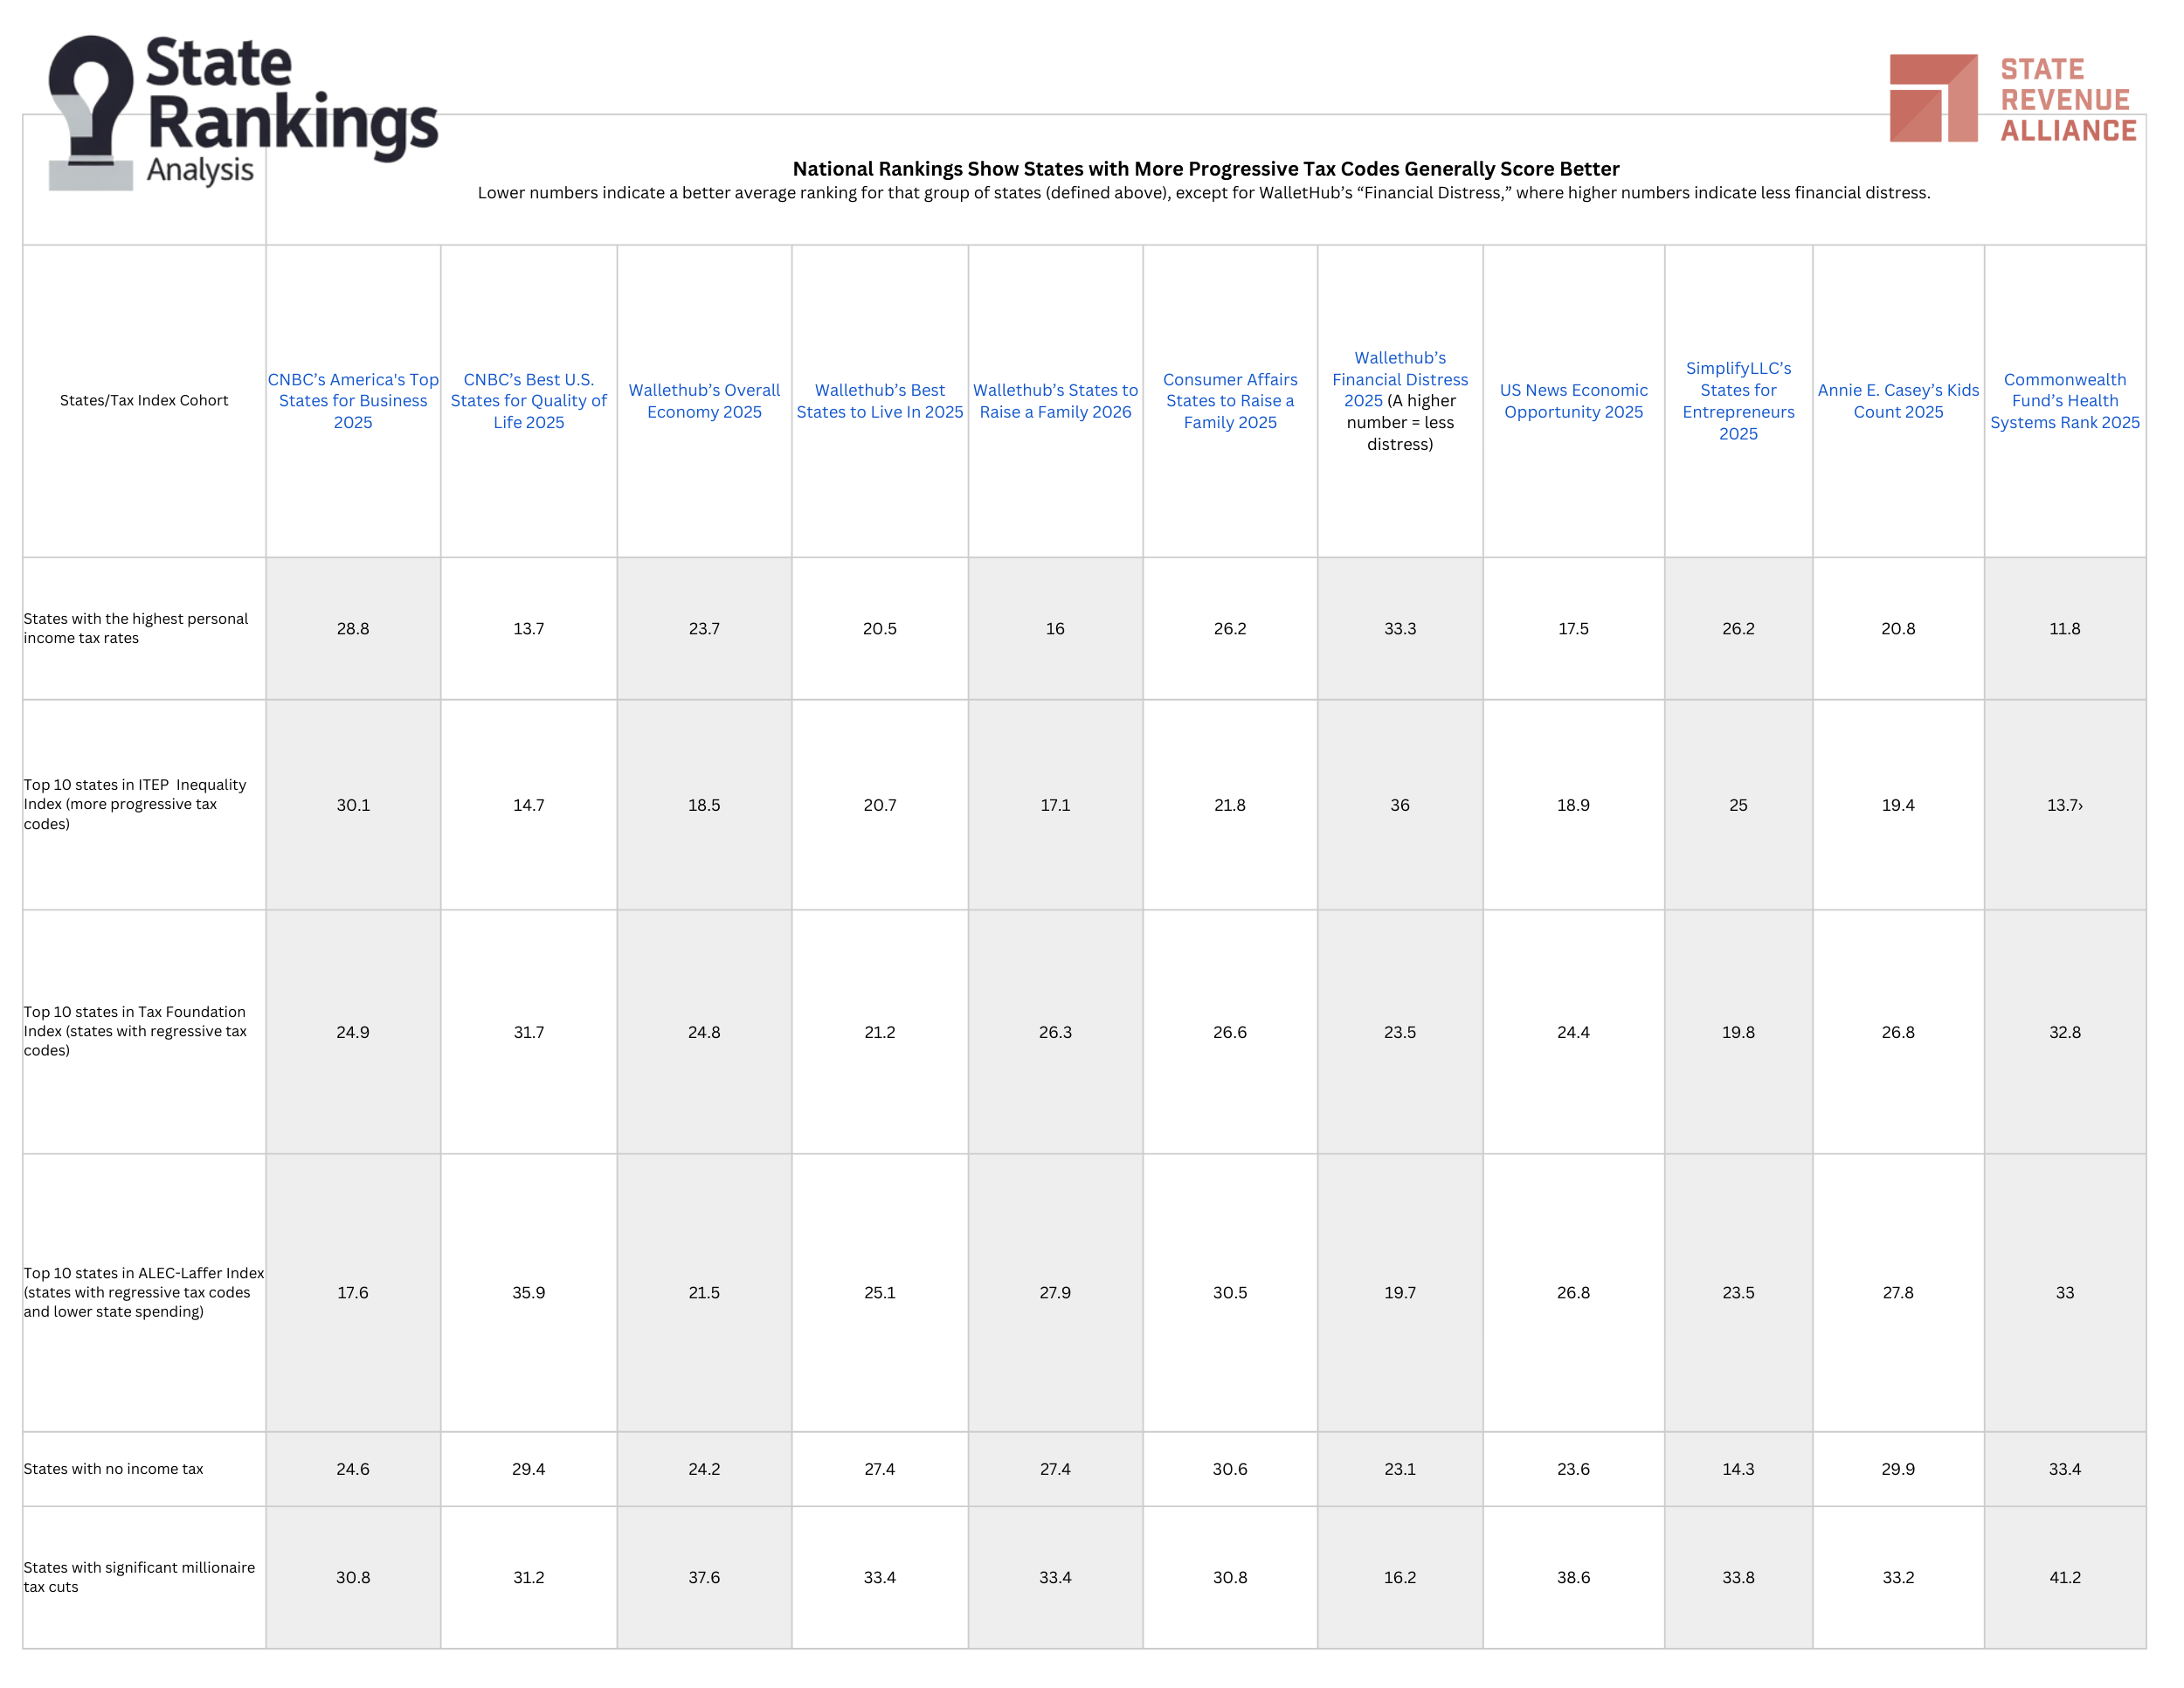
National Rankings Show States with More Progressive Tax Codes Generally Score Better
Lower numbers indicate a better average ranking for that group of states (defined above), except for WalletHub’s “Financial Distress,” where higher numbers indicate less financial distress.